- Top
- Investor Relations
- Financial Information
- Segment Information (Previous Business Segment)
- Investor Relations
- Management PolicyManagement Policy
- Financial InformationFinancial Information
- IR LibraryIR Library
- Financial Results
- Brief Summary
- Presentation Materials
- Annual Securities Report
- IR Day
- Integrated Reports / Corporate Governance Report (Archive)
- Corporate Outline(Overview)
- Corporate Outline(Numerical Data)
- Consolidated Financial Results
- Sustainability Data Book
- Management Report (Integrated Report)
- Stock and BondsStock and Bonds
- News Release
- IR Site Map

Segment Information (Previous Business Segment)
Last update: April 6, 2017
Business Segments
Geographic Area Segments
(Fiscal years ended February 28 or 29.)
Business Segments
Convenience store operations Superstore operations Department store operations Food services Financial services
Mail order services Others Eliminations/Corporate
Convenience store operations
Superstore operations
Department store operations
Food services
Financial services
Mail order services
Others
Eliminations/Corporate
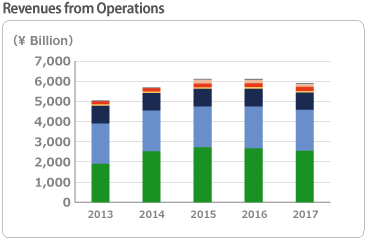
| Revenues from Operations | (Millions of yen) |
| For the fiscal year | 2013 | 2014 | 2015 | 2016 | 2017 |
| Convenience stores | 1,899,573 | 2,529,694 | 2,727,780 | 2,675,890 | 2,550,640 |
| Superstores | 1,994,588 | 2,009,409 | 2,012,176 | 2,060,516 | 2,025,534 |
| Department stores | 884,028 | 871,132 | 875,027 | 884,716 | 852,174 |
| Food services | 78,361 | 78,566 | 80,980 | 83,839 | 82,562 |
| Financial services | 144,355 | 158,826 | 178,221 | 192,487 | 201,932 |
| Mail order services | - | - | 185,802 | 158,732 | 139,226 |
| Others | 50,210 | 50,492 | 53,897 | 61,582 | 57,424 |
| Eliminations/Corporate | (59,475) | (66,301) | (74,937) | (72,061) | (73,805) |
| Total | 4,991,642 | 5,631,820 | 6,038,948 | 6,045,704 | 5,835,689 |
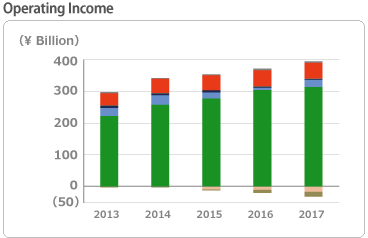
| Operating Income | (Millions of yen) |
| For the fiscal year | 2013 | 2014 | 2015 | 2016 | 2017 |
| Convenience stores | 221,764 | 257,515 | 276,745 | 304,110 | 313,195 |
| Superstores | 25,491 | 29,664 | 19,340 | 7,234 | 22,903 |
| Department stores | 8,029 | 6,590 | 7,059 | 3,832 | 3,672 |
| Food services | 721 | 604 | 44 | 917 | 515 |
| Financial services | 37,425 | 44,902 | 47,182 | 49,697 | 50,130 |
| Mail order services | - | - | (7,512) | (8,451) | (15,097) |
| Others | 3,886 | 2,166 | 3,669 | 5,559 | 4,632 |
| Eliminations/Corporate | (1,634) | (1,784) | (3,188) | (10,578) | (15,379) |
| Total | 295,685 | 339,659 | 343,331 | 352,320 | 364,573 |
| Assets | (Millions of yen) |
| At fiscal year-end | 2013 | 2014 | 2015 | 2016 | 2017 |
| Convenience stores | 1,370,292 | 1,630,826 | 1,927,221 | 1,982,681 | 2,105,931 |
| Superstores | 967,887 | 1,000,318 | 1,040,068 | 1,047,824 | 1,004,561 |
| Department stores | 517,075 | 501,856 | 495,961 | 485,700 | 431,589 |
| Food services | 21,843 | 22,398 | 26,307 | 25,200 | 26,399 |
| Financial services | 1,716,745 | 1,798,059 | 1,871,705 | 1,929,839 | 1,925,815 |
| Mail order services | - | 103,437 | 105,717 | 81,941 | 56,610 |
| Others | 168,047 | 169,602 | 207,073 | 186,078 | 179,884 |
| Eliminations/Corporate | (499,494) | (415,117) | (439,351) | (297,574) | (221,904) |
| Total | 4,262,397 | 4,811,380 | 5,234,705 | 5,441,691 | 5,508,888 |
| Capital Expenditures | (Millions of yen) |
| For the fiscal year | 2013 | 2014 | 2015 | 2016 | 2017 |
| Convenience stores | 214,250 | 197,715 | 193,235 | 238,372 | 273,072 |
| Superstores | 54,243 | 66,686 | 65,490 | 81,354 | 50,630 |
| Department stores | 18,265 | 15,596 | 15,380 | 17,515 | 15,195 |
| Food services | 1,407 | 2,277 | 3,506 | 1,853 | 2,081 |
| Financial services | 40,945 | 39,326 | 39,110 | 33,422 | 26,070 |
| Mail order services | - | - | 3,815 | 4,766 | 1,864 |
| Others | 4,331 | 7,567 | 5,381 | 3,678 | 4,830 |
| Corporate | 772 | 7,588 | 15,152 | 18,240 | 10,373 |
| Total | 334,216 | 336,758 | 341,075 | 399,204 | 384,119 |
| (Notes) | Capital expenditures include long-term leasehold deposits and advances for store construction. |
| Depreciation and Amortization | (Millions of yen) |
| For the fiscal year | 2013 | 2014 | 2015 | 2016 | 2017 |
| Convenience stores | 83,987 | 91,256 | 103,247 | 116,514 | 123,131 |
| Superstores | 29,129 | 18,472 | 20,696 | 23,800 | 25,280 |
| Department stores | 14,662 | 13,460 | 13,399 | 13,569 | 12,982 |
| Food services | 639 | 438 | 709 | 828 | 869 |
| Financial services | 23,668 | 20,198 | 25,233 | 29,071 | 29,416 |
| Mail order services | - | - | 3,842 | 3,730 | 3,956 |
| Others | 2,484 | 2,524 | 2,689 | 2,958 | 2,983 |
| Corporate | 1,094 | 1,029 | 2,419 | 5,036 | 8,862 |
| Total | 155,666 | 147,379 | 172,237 | 195,511 | 207,483 |
Geographic Area Segments
Japan North America Others Eliminations
Japan
North America
Others
Eliminations
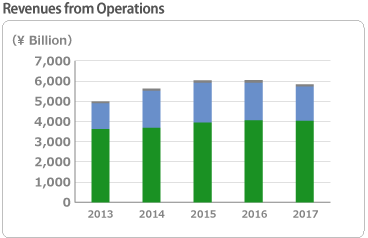
| Revenues from Operations | (Millions of yen) |
| For the fiscal year | 2013 | 2014 | 2015 | 2016 | 2017 |
| Japan | 3,625,974 | 3,682,143 | 3,941,337 | 4,056,272 | 4,032,803 |
| North America | 1,269,302 | 1,831,482 | 1,968,854 | 1,855,305 | 1,690,713 |
| Others | 97,226 | 119,207 | 131,058 | 136,058 | 113,475 |
| Eliminations | (861) | (1,012) | (2,301) | (1,931) | (1,303) |
| Total | 4,991,642 | 5,631,820 | 6,038,948 | 6,045,704 | 5,835,689 |
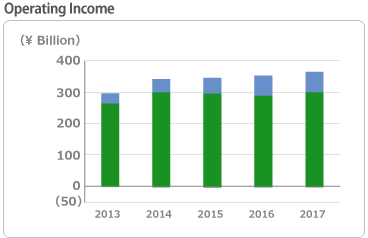
| Operating Income | (Millions of yen) |
| For the fiscal year | 2013 | 2014 | 2015 | 2016 | 2017 |
| Japan | 263,443 | 299,653 | 295,666 | 288,068 | 299,251 |
| North America | 33,137 | 41,519 | 49,825 | 65,148 | 65,548 |
| Others | (909) | (1,545) | (2,161) | (842) | (238) |
| Eliminations | 13 | 32 | 1 | (53) | 11 |
| Total | 295,685 | 339,659 | 343,331 | 352,320 | 364,573 |
| (Note) | "Others" consists of the business results in China, etc. |